Evaluation Services that Drive Impact, Insight and Innovation – The Evaluator UK
At The Evaluator, we offer a comprehensive suite of evaluation services tailored to the needs of UK organisations across the cultural, community, and public sectors. From project evaluation and social return on investment to bespoke evaluation frameworks and digital tools, our work is designed to generate actionable insights and support real-world impact. Whether you’re measuring change, improving delivery, or strengthening your case to funders, we help you tell your story with clarity, confidence, and evidence. Explore our services to see how evaluation can drive your mission forward.
Our services
Project Evaluation
The Evaluator takes a strategic and insightful approach to project evaluation, ensuring that data collection is not just a process but a tool for real impact. We go beyond ticking boxes, focusing on gathering meaningful insights that help shape and strengthen organisations. By balancing efficiency with depth, we ensure that every piece of data serves a clear purpose—helping organisations to understand their audiences, measure success, and identify opportunities for growth. Our evaluations are not just about reporting results; they are about guiding future decisions, making sure that each project reaches its full potential.
At the core of our approach is a commitment to making evaluation both practical and powerful. We recognise common challenges, such as time constraints and survey fatigue, and address them with streamlined, intelligent methods that prioritise quality over quantity. Our focus is not on overwhelming organisations with data but on ensuring that insights are actionable and drive meaningful change. Crucially, we believe that data should never sit unused in reports—it should actively shape the future. Through our work, we help organisations remain relevant, responsive, and ready to grow, turning evaluation into a dynamic force for progression.
Evaluation Frameworks
At The Evaluator, we create evaluation frameworks that are clear, strategic, and designed for real-world impact. Our frameworks are not just documents—they are roadmaps that guide organisations in measuring success effectively and meaningfully. We take a tailored approach, ensuring each framework aligns with an organisation’s goals, values, and ambitions. By identifying the right metrics and methods, we help organisations track progress, demonstrate value, and make informed decisions. Our focus is always on creating frameworks that are practical, easy to use, and capable of driving real learning and improvement.
What sets our evaluation frameworks apart is our ability to balance rigour with usability. We strip away unnecessary complexity and provide structured, accessible tools that make data collection and analysis seamless. We ensure that organisations don’t just gather data but use it to reflect, adapt, and grow. Our frameworks give teams the confidence to evaluate their work effectively, turning insights into action. By embedding evaluation at the heart of a project, we empower organisations to make a lasting impact, proving not just what they have achieved but how they can achieve even more.
Social Return on Investment
At The Evaluator, we design Social Return on Investment (SROI) projects that go beyond the numbers, capturing the full impact of an organisation’s work. We take a rigorous yet accessible approach, translating complex data into clear, compelling insights that showcase both financial and social value. Our method goes beyond traditional reporting, helping organisations quantify the wider benefits they create—whether that’s improving wellbeing, increasing opportunities, or strengthening communities. By working closely with organisations, we ensure that our SROI projects reflect their unique impact, providing the evidence they need to demonstrate their value with confidence.
Our expertise lies in making SROI both meaningful and actionable. We don’t just calculate figures; we tell the story behind them, ensuring that social impact is fully recognised and understood. Our process helps organisations to identify where they are making the biggest difference and where they can maximise their impact even further. With a focus on clarity and strategic insight, we provide organisations with the tools needed to communicate their value to funders, stakeholders, and communities. Through our SROI projects, we empower organisations to strengthen their case for support, enhance decision-making, and drive lasting, positive change.
Impact Evaluation
At The Evaluator, we deliver impact evaluations that go beyond surface-level reporting to uncover the true effects of a project or programme. Our approach is rooted in clarity, relevance, and depth, ensuring that organisations can confidently demonstrate the differences they are making. We design evaluations that capture both the tangible and intangible outcomes—whether it’s shifts in attitudes, improvements in wellbeing, or long-term societal benefits. By using robust methods tailored to each organisation’s needs, we provide meaningful insights that highlight successes, identify areas for growth, and support future planning.
What sets our impact evaluations apart is our ability to turn data into compelling narratives that resonate with stakeholders. We go beyond simply measuring change; we help organisations to understand why and how change happens. Our evaluations provide actionable insights, helping teams refine their strategies and amplify their impact. With a focus on practical recommendations, we ensure that evaluation is not just a retrospective exercise but a forward-thinking tool for learning and development. Through our work, we help organisations strengthen their impact, communicate their value effectively, and drive meaningful, lasting change.
Process Evaluation
At The Evaluator, we specialise in process evaluations that provide organisations with a clear understanding of how their work is being delivered and where it can be optimised. Our approach focuses on uncovering what’s working well, identifying challenges, and refining processes to maximise effectiveness. By examining implementation, decision-making, and operational dynamics, we help organisations strengthen their approach in real-time rather than waiting until a project’s end. Our evaluations are designed to be practical and insightful, offering clear recommendations that enhance efficiency, improve delivery, and ensure resources are being used to their full potential.
What makes our process evaluations stand out is our commitment to making them both reflective and action-driven. We don’t just map out workflows—we identify opportunities for streamlining, innovation, and growth. We work closely with organisations to ensure that their processes are not only effective but also sustainable and scalable. By embedding evaluation within delivery, we enable teams to adapt quickly, build resilience, and drive continuous improvement. Our evaluations turn operational insights into strategic advantages, helping organisations refine their work, strengthen their impact, and deliver with even greater confidence.
The Returns Recipe – NPO Data Return Service
The Evaluator’s NPO Return Process is a game-changing solution for National Portfolio Organisations navigating the complexity of Arts Council reporting. Designed specifically to reduce stress, save time, and boost confidence, this tailored service transforms data return from a chore into a powerful planning tool. By blending clarity, consistency, and deep understanding of the sector, The Evaluator ensures that your data returns and submissions not only meet compliance but also tell a compelling story about your impact, reach, and growth. From audience figures to workforce data, every part of the process is handled with care, strategic insight, and a sharp eye for detail.
What sets this service apart is our personal touch and sector-savvy approach. The Evaluator doesn’t just process your data—we help you make sense of it. This hands-on support includes clear templates, one-to-one advice, and optional additional analysis that turns raw numbers into meaningful insights for funders, boards, and teams alike. Whether you’re a seasoned NPO or new to the process, this service empowers you to submit with confidence, learn from your data, and use it to shape your future. It’s not just about returns—it’s about unlocking your organisation’s potential.
72 Seasons
72 Seasons is a beautifully creative project designed to deepen our connection with nature while enhancing wellbeing. Originally conceived as a research initiative by Kirsty Rose, founder of The Evaluator, it began as an exploration of how noticing small, seasonal changes can positively impact how we feel. Inspired by the ancient Japanese natural calendar of 72 micro-seasons, the project now presents a uniquely British take on these ever-shifting cycles of nature. Every four to five days, a new “season” emerges, inviting people to slow down, observe, and appreciate the subtle transformations happening all around them. Through social media, storytelling, and creative prompts, 72 Seasons encourages participants to engage with the world in a mindful, immersive way—whether that’s through photography, drawing, journaling, or simply taking a moment to notice.
At its heart, 72 Seasons is a co-created experience, shaped by the insights and observations of a dedicated community of seasonal seekers. This collaborative spirit has been integral from the start, with volunteers helping to define and refine the seasons through shared experiences and reflections. The project has evolved to be both a personal and collective journey, sparking curiosity and creativity in those who take part. People engage with it in different ways—some following along online, others using it as a guide for personal exploration or research into climate patterns. It’s a celebration of creativity, connection, and nature’s rhythms, offering a fresh perspective on the changing world around us. More than just a calendar, 72 Seasons is a movement—one that invites people to pause, notice, and find joy in the beauty of everyday nature.
Volunteer App
In 2024 we have been working on a co-created volunteer app, developed in collaboration with a volunteer in a professional capacity. Inspired by the Wilder Walkmill project and the historical Miners’ Tally Check System, this app modernises an age-old safety and tracking method. Just as colliers once checked in and out with pit checks, volunteers now create a virtual ‘tag’, recording their time and experiences on-site. This ensures project staff can keep track of volunteers for safety, support, and engagement, while also capturing rich qualitative data about their experiences. More than just a digital tool, this app is a testament to co-creation, heritage, and innovation, demonstrating how past practices can inspire future solutions. By integrating real-time feedback, this app enhances volunteer experience, strengthens project evaluation, and provides funders with invaluable insights, making it a game-changer for future community-led projects.
Miners’ tally checks were an essential safety system used in coal mines to track which workers were underground at any given time. Each miner had two identical checks—often made of brass, zinc, or aluminium—one handed in at the start of a shift in exchange for a lamp, and the other kept with them. This system ensured that in the event of an accident, supervisors could quickly identify who was still inside the mine. The checks came in various shapes and designs, sometimes featuring the miner’s number or the colliery’s name, making them a practical yet deeply personal part of mining history.
 My name is Nadia and I am excited to announce myself as the newest intern here at The Evaluator.
 nternship with The Evaluator my goal is to develop my data and report writing skills, both of which I feel I have already made a start on in the 2 months since I have been here. I’m excited to go forward and see what the new year has in store and I can’t wait to see what I can learn from Kirsty and the team.
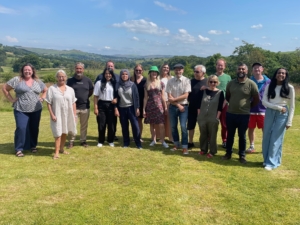 Reflection sessions can be a really important part of the package that we offer to clients, in terms of evaluation services.
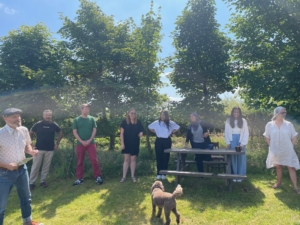 ould make a big difference to that project.
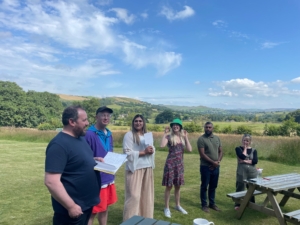 ssionate devotees to democracy we also want to hear from people who are more junior or merely just shy in general. Their knowledge and life experiences are really valuable.